EKG READING
Normal Cardiac Activation
Electrical activation of the heart depends on the spread of a depolarizing wave front from pacemaker cells through cardiac muscle, as well as specialized conducting tissues
This electrical wave front spreads throughout the right and left atria; specialized conducting tracts called Bachmann’s bundle speed the depolarizing wave front to the left atrium.
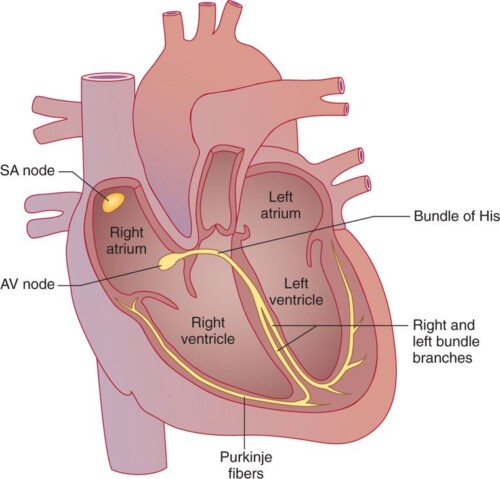
Electrical atrial activation triggers atrial muscular contraction, which pumps blood through the tricuspid and mitral valves into the right and left ventricles. Normally, the atrioventricular (AV) node, where conduction delay is physiologic, serves as the only electrical connection linking the atria and ventricles; the AV valve rings are insulated. The depolarizing wave front exits the AV node into the bundle of His, a specialized conducting tissue capable of rapid conduction. The bundle of His bifurcates into right and left bundle branches; the left bundle branch divides into the left anterior and left posterior fascicles.
Cardiac conduction system. The normal conducting system consists of pacemaker cells in the sinoatrial (SA) nodal complex, specialized intra-atrial conducting tracts (including Bachmann’s bundle), the atrioventricular (AV) node, the His-Purkinje system, and working atrial and ventricular myocardium.
At the cellular level, a complex orchestration of ion channels opening and closing determines the membrane potential throughout this process.
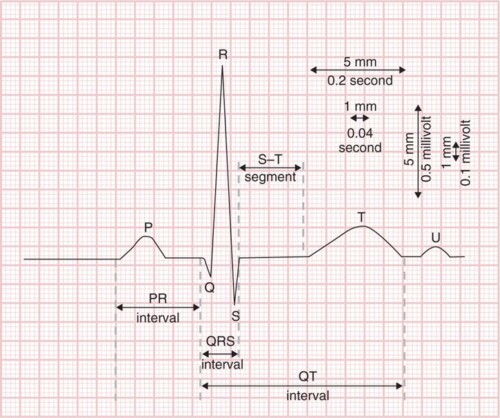
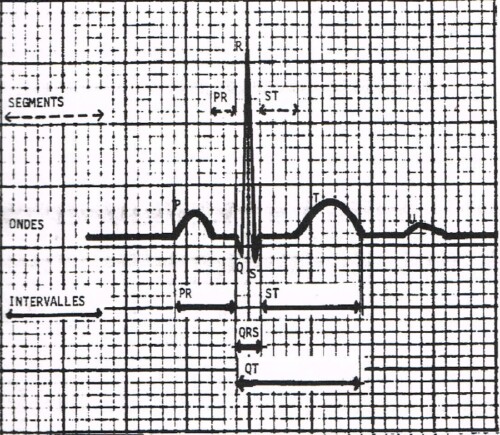
Inscription of a normal electrocardiogram (ECG). Sinoatrial nodal depolarization is not visible on the surface ECG; the P wave corresponds to atrial mechanical contraction.
The PR interval denotes conduction through the atrial muscle, atrioventricular node, and His-Purkinje system. The QRS complex reflects ventricular muscle depolarization. The ST segment and T wave correspond to ventricular repolarization.
On the horizontal axis, each 1-mm line (“small” box) denotes 0.04 second (40 msec); a “big” box denotes 0.2 second (200 msec). On the vertical axis, 1 mm (“small” box) corresponds to 0.1 mV; 10 mm (two “big” boxes) therefore denotes 1 mV.
Heart rate
50–100 beats per minute
P wave duration
<0.12 sec (120 msec)
PR interval
0.09 (90 msec) to 0.20sec (200 msec)
QRS duration
0.07 (70 msec) to 0.11sec (110 msec)
QTc
0.44 sec (440 msec)
QRS axis
−30 to +100 degrees
Electrocardiography Standards
A standard ECG is recorded on paper with 1-mm (“small” boxes) as well as 5-mm (“big” boxes) gridlines.
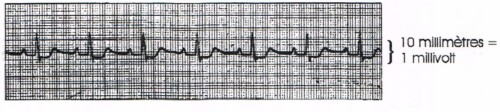
Voltage amplitude is measured on the vertical axis (typically 10 mm equaling 1 mV) and time on the horizontal axis. Because the usual ECG recording speed is 25 mm/sec, each 1-mm gridline (“small” box) represents 0.04 second (40 msec), and each 5-mm gridline (“big” box) equals 0.2 second (200 msec). These parameters are the usual calibration or standardization.
A standard ECG is recorded over a 10-second period.
Multiple leads are typically recorded simultaneously from the top to the bottom of the page.
The usual groupings of leads include I, II, and III; aVR, aVL, and aVF; V1, V2, and V3; and V4, V5, and V6 (see later). Each group of leads is recorded for 2.5 seconds.
A single lead (or multilead) rhythm strip is recorded below for the entire 10 seconds. Thus, as the ECG is scanned from left to right, one sees 10 seconds of cardiac activity, with each complex recorded simultaneously in multiple leads.
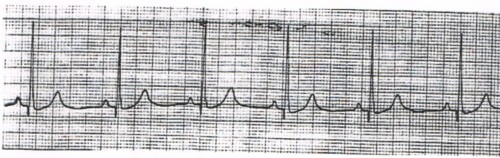
INTERPRETATION STRIP 1
General Impression:
Isoelectrical line:
P Wave
PR interval
QRS Complexe:
ST Segment:
T wave:
Interpretation:
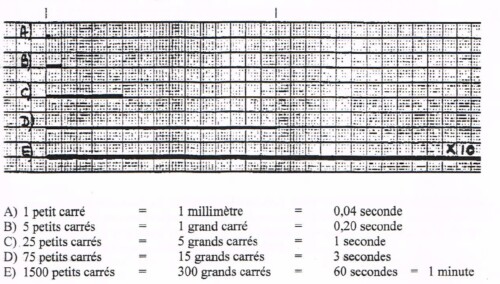
Please Read power point presentation. It different ways of counting the squares ECG interpretation